Joy(Ruoqian) Wang

My name is Joy, a data enthusiast stuffed with 6-year environmental academical knowledge. I am currently working in telecommunication engineering field and I also have some experience of customer service and management in hospitality industry.
I am passionate about diving in data, and building business logics from stakeholders' communications. And thanks to my multi-industries career path, I am able to understand and utilize data in business to deliver insights, most importantly, it made who I am today!
View My LinkedIn Profile
View My Tableau Work Samples
Joy Wang’s Portfolio
Data Visualization Samples
- Connecting to a data source
- Creating simple graphs and visuals
- Basic interactive dashboard
- Understand and use different joins in Tableau (INNER JOIN, LEFT/RIGHT JOIN, FULL JOIN)
-
Creating a storyline and advanced dashboard
- Practice problems:
- Long-term US Unemployment Stats by gender and age
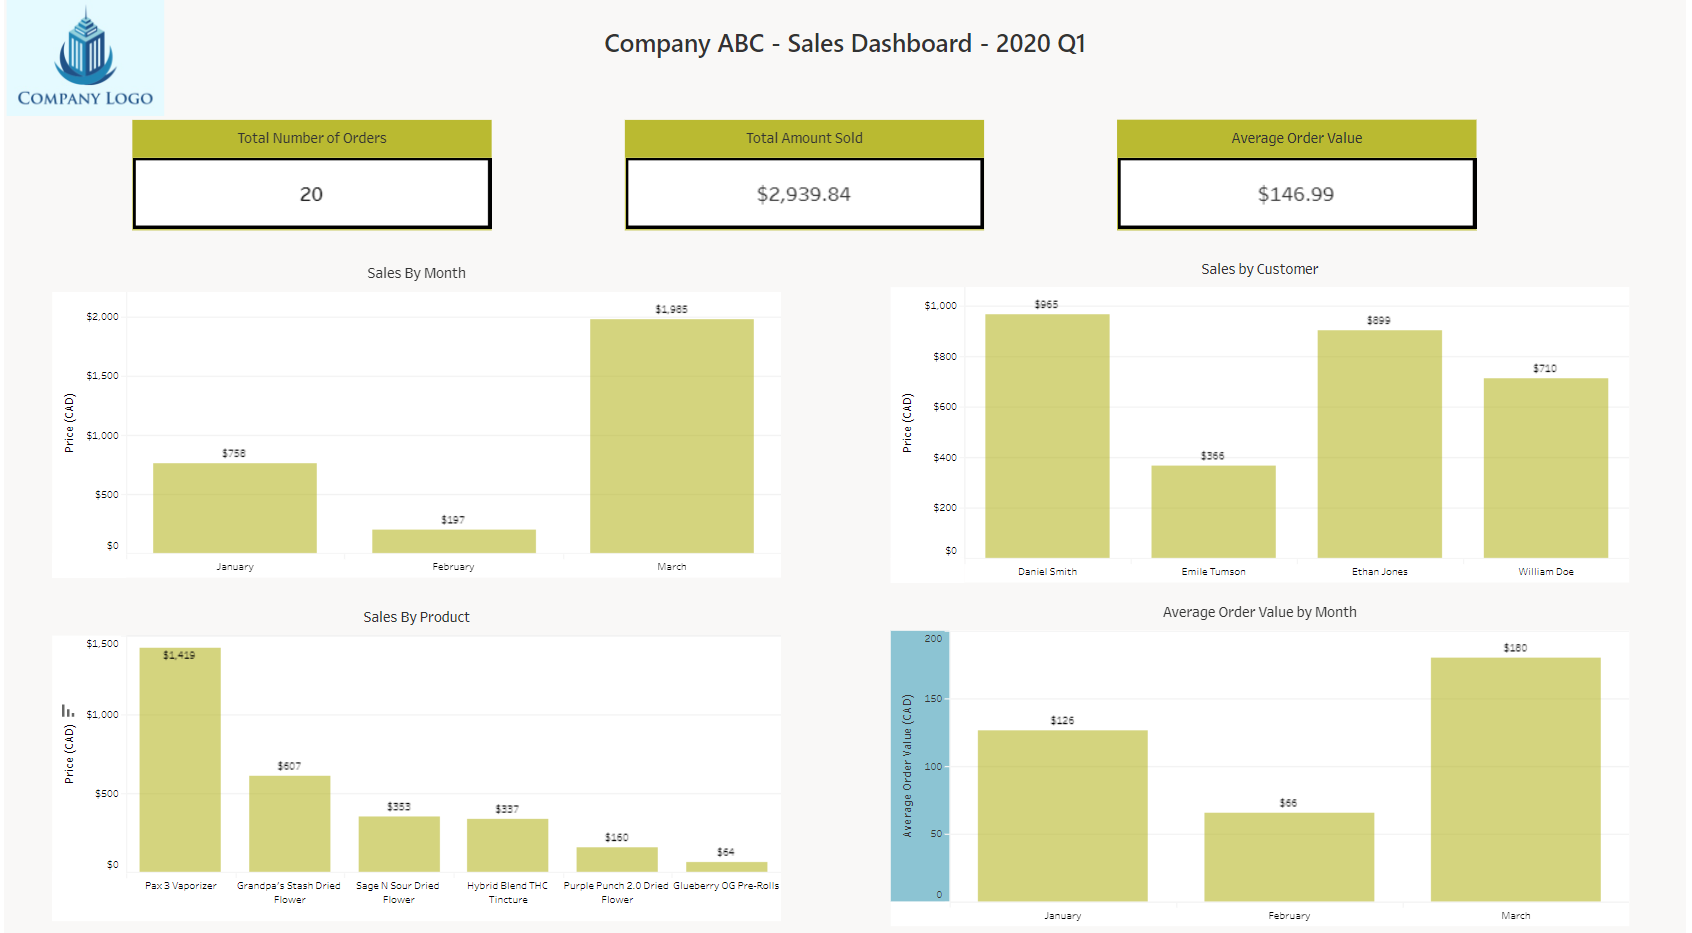
- Department store sale performance report by employee, region, product and different months
- World CO2 Emissions
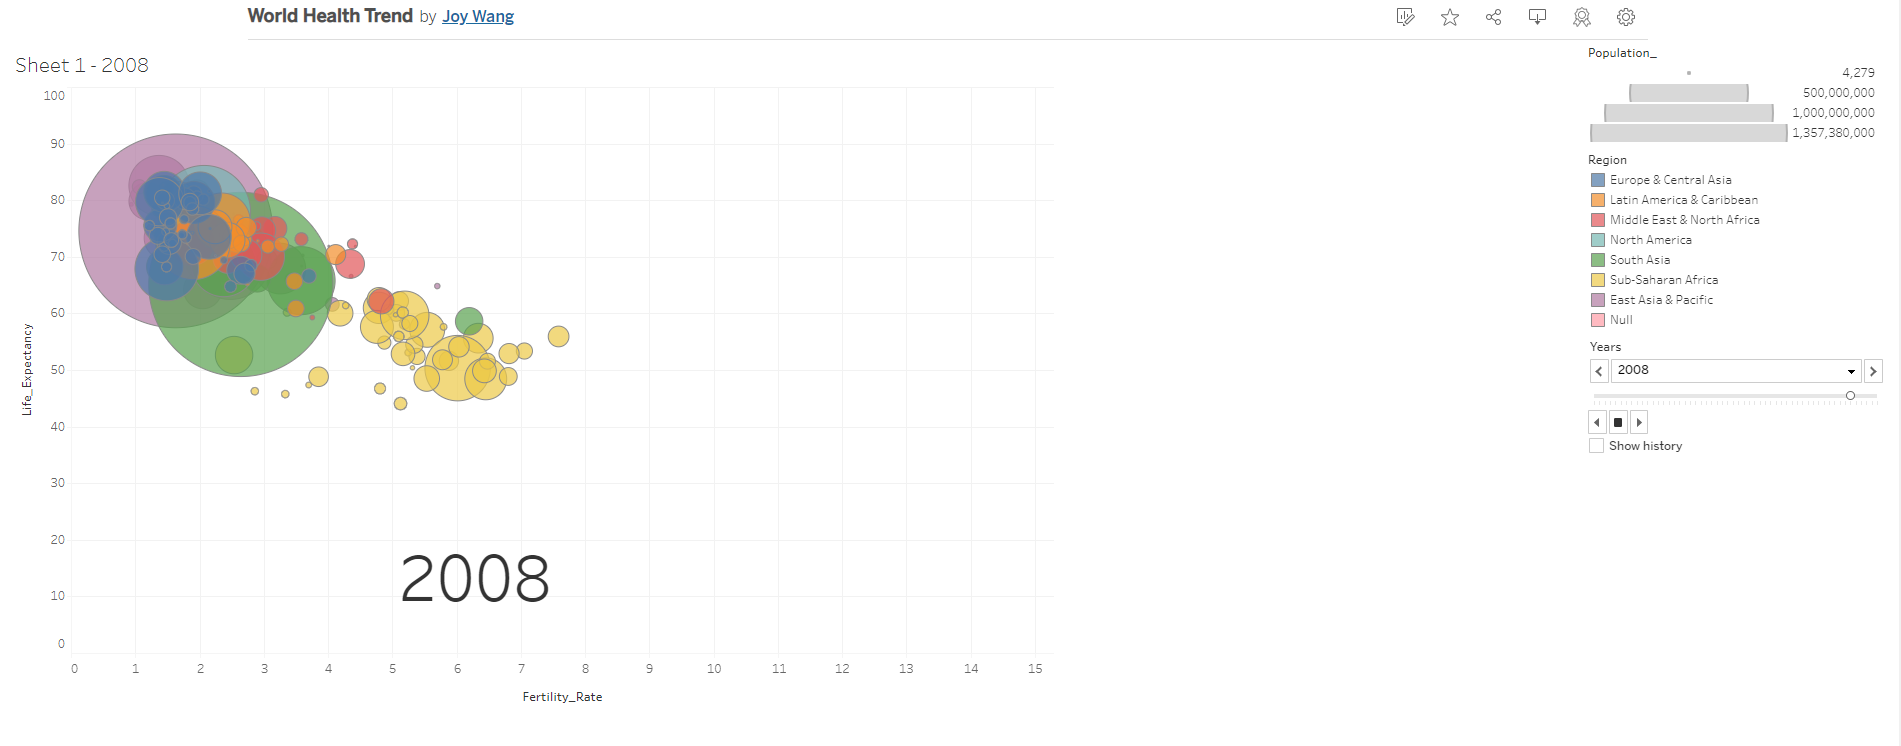
- World life expectancy by countries and years
- Query Editor: Extract-Transform-Load Data
- Model: Relationships and Data Analysis Expressions
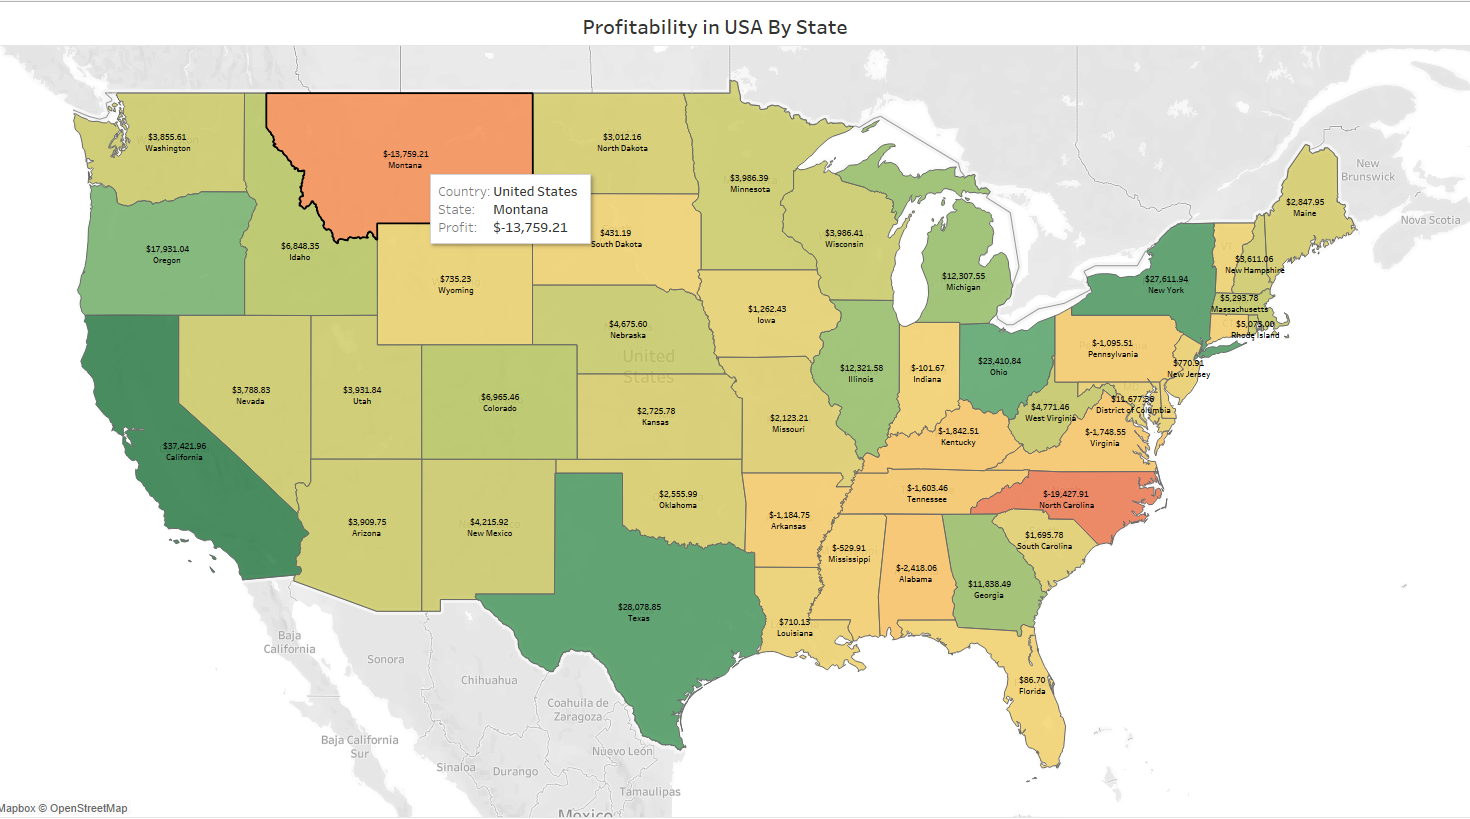
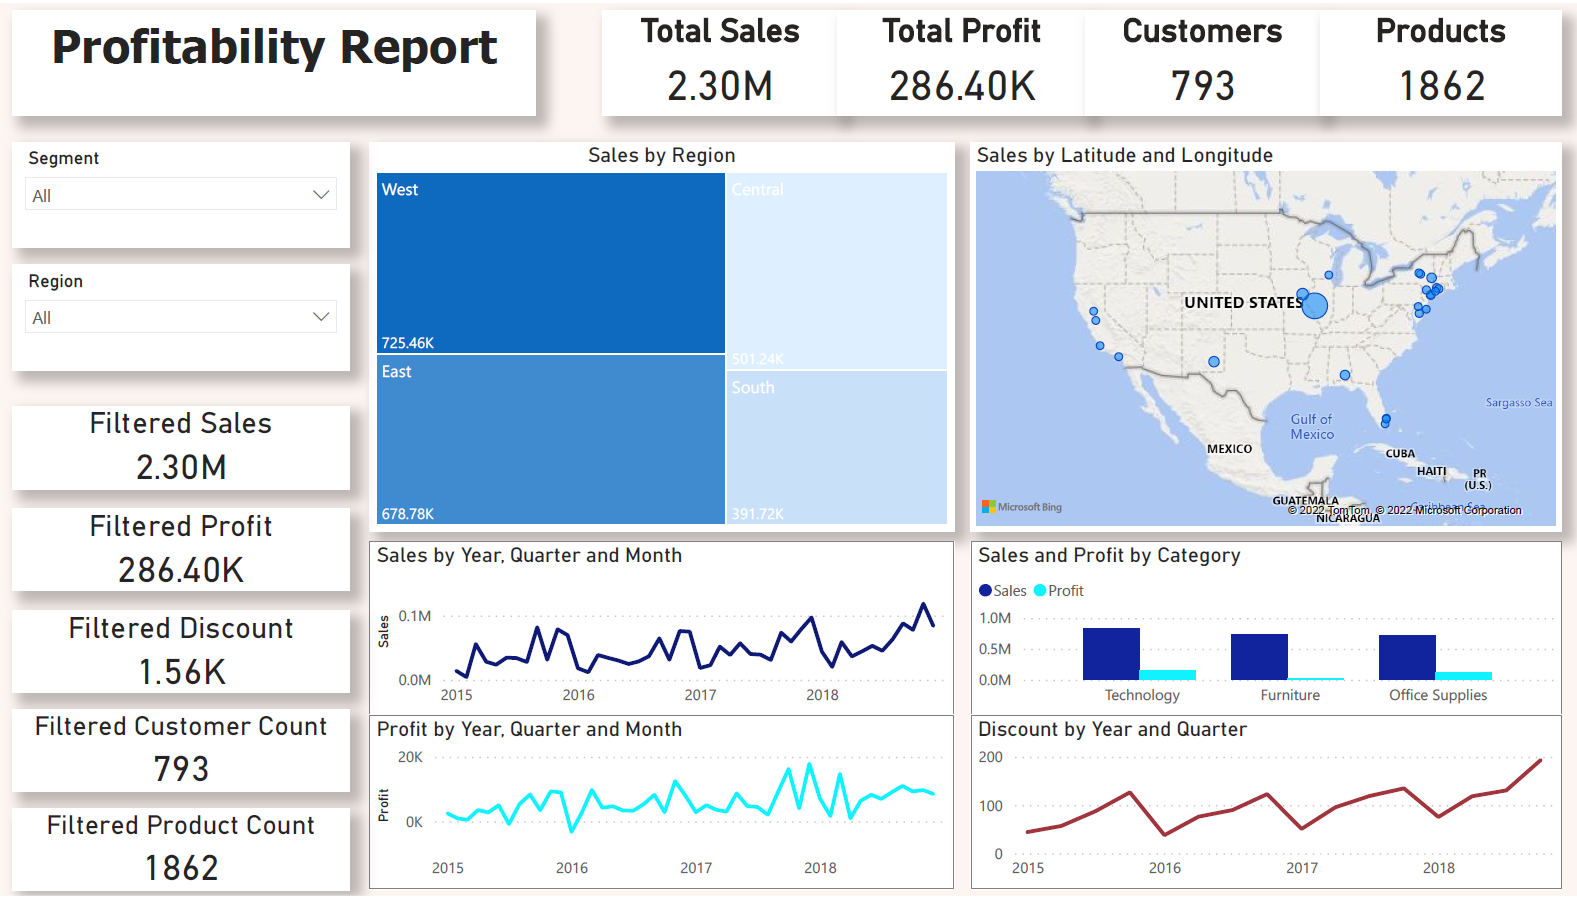
- Provided actionable insights of Superstore department sales by country, category and customer
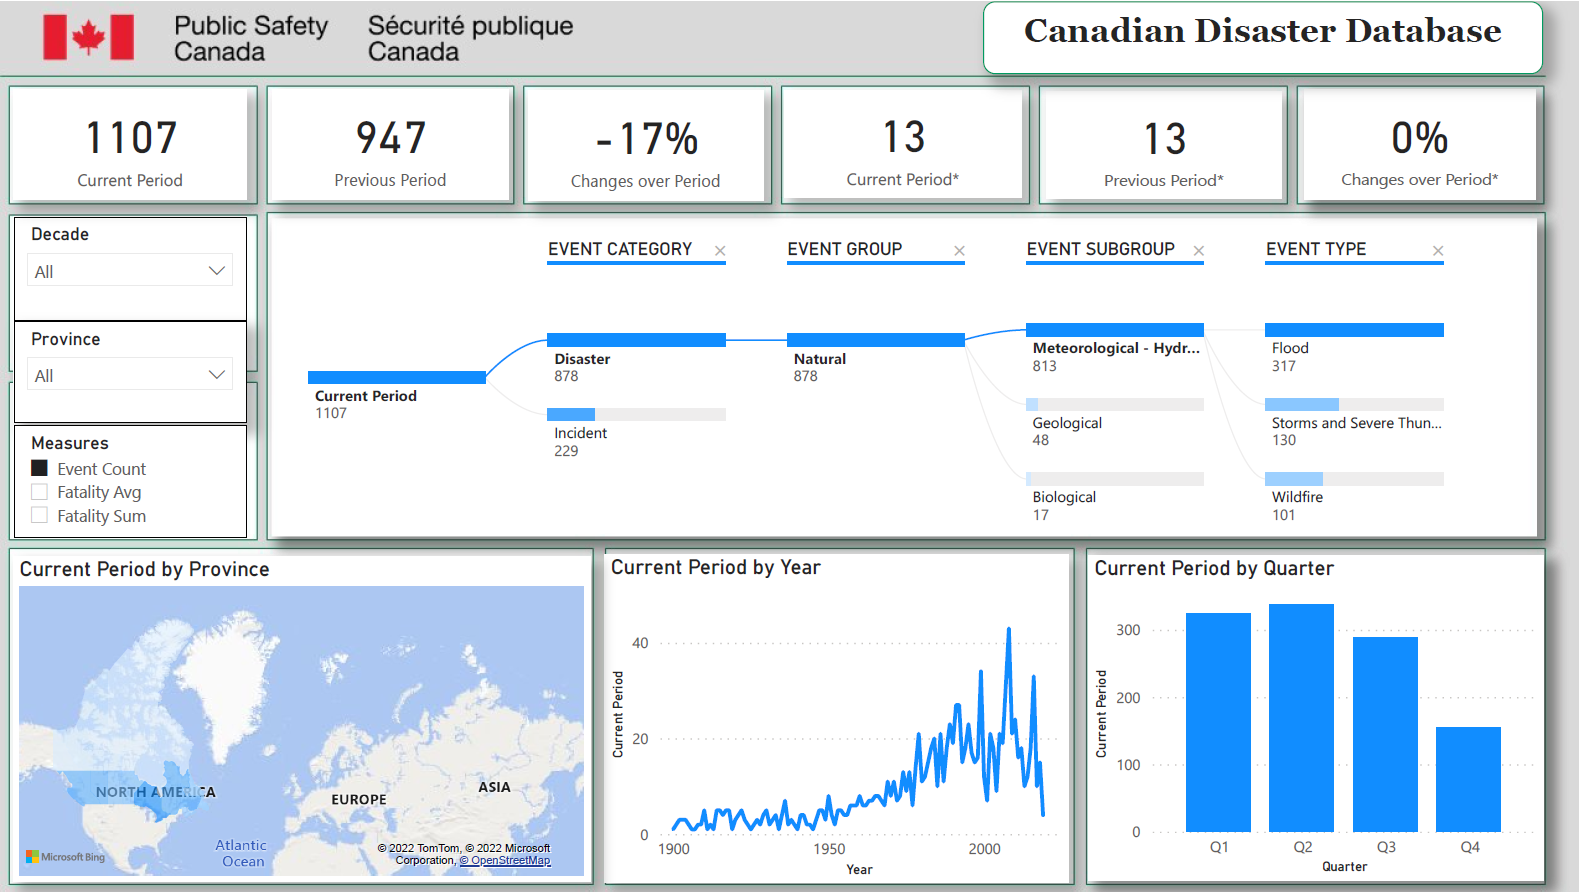
- Explored Canadian disaster incidents by years, type of disaster, fatality and location
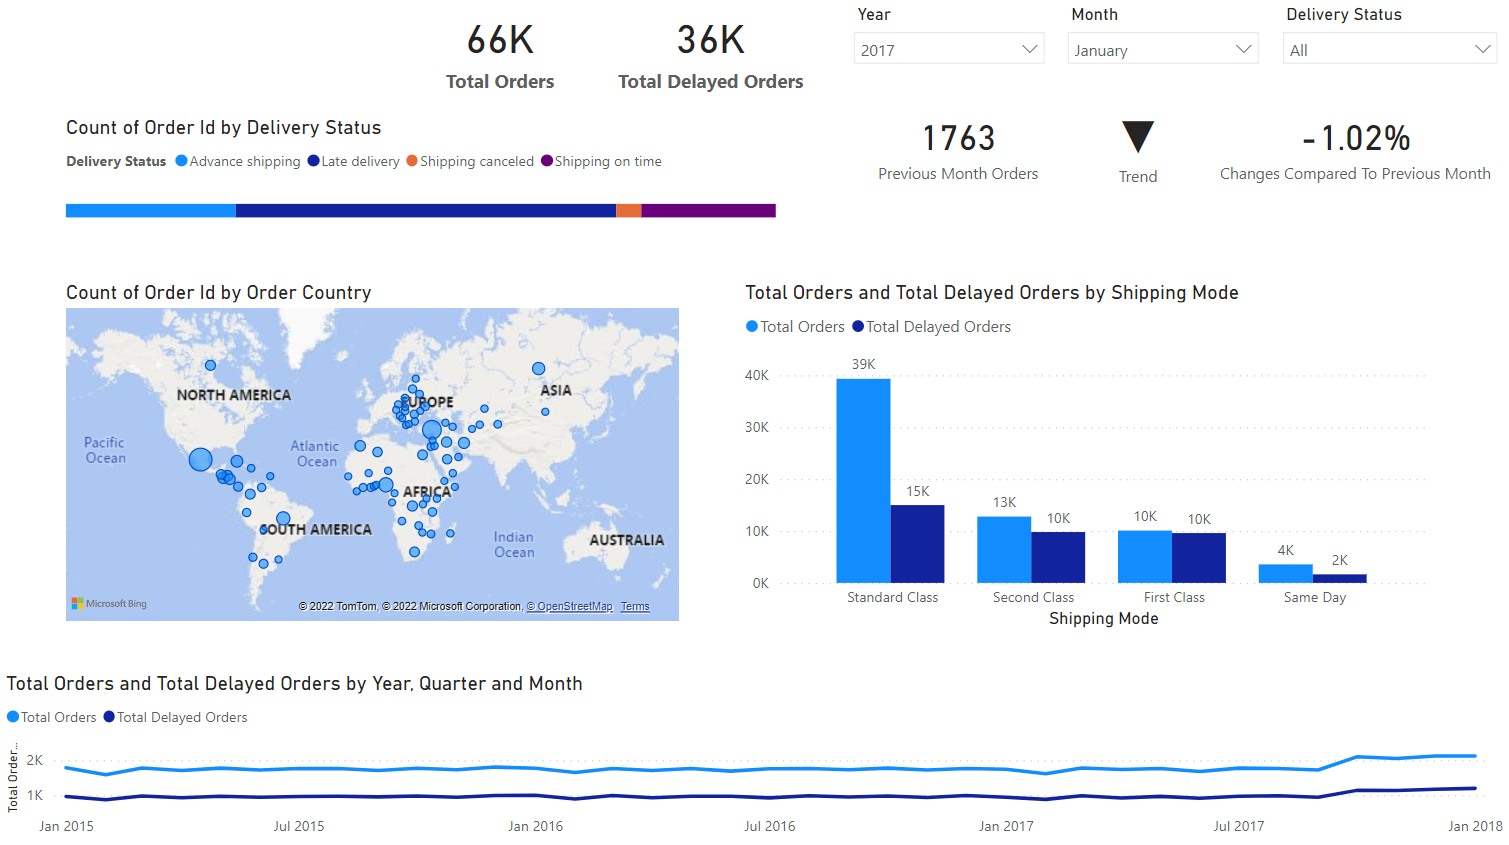
- Built supply chain report by looking into its delivery status, shipping mode and delayed orders status
Data Science Samples
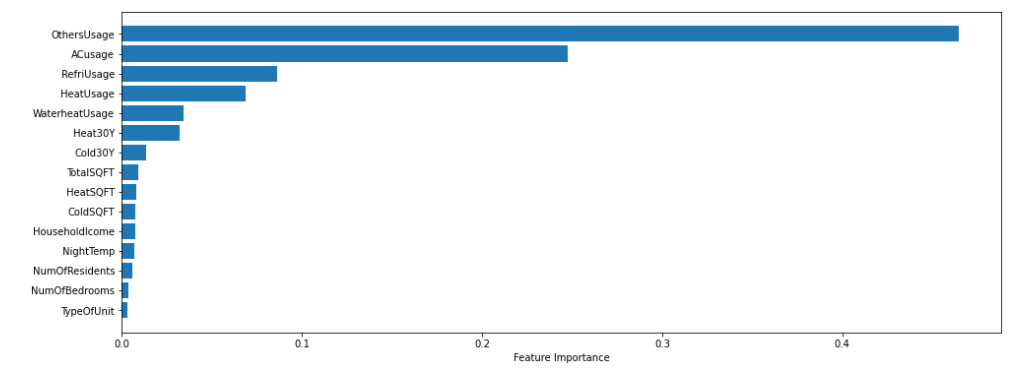
Predict Household Electricity Consumption with Machine Learning (Machine Learning, Python, Excel)
- Used energy/electricity usage related charactistics like housing unit, usage patterns, and household demographics to build a model that will allow us to understand the status and project future consumption trends
- Prepared data by removing empty records and imputing missing values, and identified features correlated to defaulted accounts.
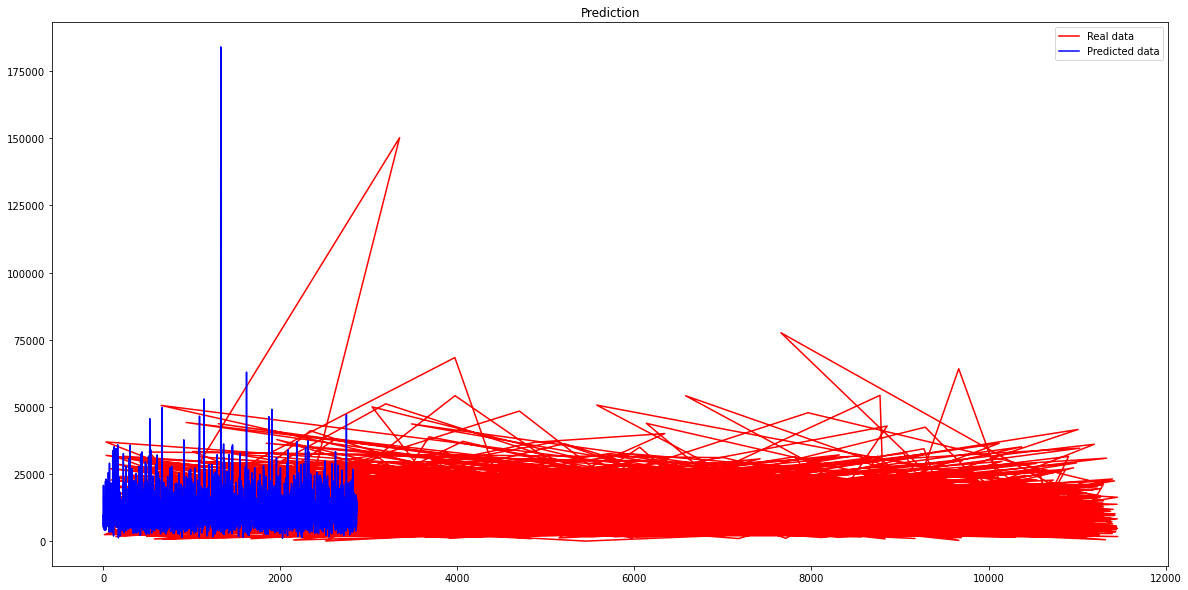
- Implemented Artificial Neural Networks (ANN) for regression and fitting
- Evaluated the performance of the model
Home Credit Default Risk Prediction (SQL, Machine Learning, Python)
- Calculated credit-to-income ratio, average income, numbers of bad debt and refused accounts, etc. for 300,000 records using SQL.
- Prepared data by removing empty records and imputing missing values, and identified features correlated to defaulted accounts.
- Transformed categorical variables into dummy variables using one-hot encoding.
- Implemented and compared Logistic Regression and Random Forest models.
Post Marketing Campaign Analysis (A/B Testing, BI, SQL, Python)
- Acquired data from marketing campaigns of a Portugal bank, and implemented data pipeline with SQL connector in Python.
- Visualized 10,000 campaign records in Plotly, an interactive plot enables segmentation of different campaigns and other characteristics (e.g. users per age group, valid offers per day).
- Completed conversion and retention rate analysis, determining the most effective channel which obtained highest conversion rate.
- Applied A/B testing on the email channel, the statistical significance showed the customized emails improved marketing efficiency.
Page template forked from evanca